Understanding of methane’s role in climate change suffers from a blurry image. The negative impact of methane is often forgotten because of its short short half life in the atmosphere. Furthermore, the concept of the Global Warming Potential (GWP, that allows comparison of the climate impact of various GHGs over a given time horizon) has generally been misunderstood, leading to misinterpretation. Fortunately, on the basis of the conclusions and comments made by the IPCC in its last report, a simple algorithm allows a rough assessment of the climatic consequences, at various time horizons, of different climate change strategies, without the need to engage in complex and costly climate modelling calculations. By making it possible to differentiate the respective responsibilities of each of the greenhouse gases in expected temperature increase resulting from a given emission scenario, this policy targeted algorithm reveals the importance that should be attributed to methane emission reductions in the fight against global warming.
The exit of the United States from the Paris agreements has just spectacularly put back on the front of the scene the question of the climate. It was already known that the contributions of States currently associated with these agreements, even with an active presence of the United States, are not sufficient to hope to maintain the increase in the temperature of the Earth’s surface below 2 °C at 2100 horizon compared to the pre-industrial period, and therefore a fortiori to maintain it below 1.5 °C, value considered by a very large number of actors, as necessary to avoid phenomena too dangerous for humanity. The default of the United States whose emissions represent 15% of total greenhouse gas emissions makes the equation even more difficult to solve. In this context it becomes necessary, before the facilitation dialogue of 2018, to see under what conditions, everyone could go faster and further in limiting its emissions of greenhouse gases.
Since the beginning of the 1990s, the concerns of the scientific community and the negotiators on the fight against climate change have mainly focused on the issue of the reduction of carbon dioxide emissions. There were, and still are, excellent reasons for this priority : a) CO2 is the first greenhouse gas because of the importance of its emissions and its consequences in warming. In its latest report for the policy makers (1), the IPCC estimates that from 1750 to 2010 the radiative forcing attributable to CO2 emissions represents 56% of the radiative forcing attributable to all greenhouse gases. b) Its lifetime in the atmosphere is well over a hundred years, a longevity that gives irreversibility to policies (or the absence of policies) concerning this gas, a major criterion of the risk incurred, which must rightly make think. c) We know how to quantify, with reasonable accuracy, the emission quantities of the main sources of CO2.
This understandable attention is beginning to bear fruit. In recent years there has been a slowdown in the growth of global CO2 emissions. On the other hand, the policies posted under the Paris agreement, the first effects of the coal disinvestment campaigns initiated by major NGOs and a series of local initiatives on the disengagement of fossil fuels and the development of renewable energies can reasonably hope for a significant decrease in energy-related CO2 emissions in the coming decade.
1. WHAT ABOUT GREENHOUSE GASES OTHER THAN CO2 ?
The other two main greenhouse gases, methane CH4 and nitrous oxide N2O, do not receive the same attention. Regarding methane, however, the IPCC report already cited reminds us of its importance since it would be responsible, directly or indirectly, and over the same period 1750-2010, for 32.3% of total radiative forcing.
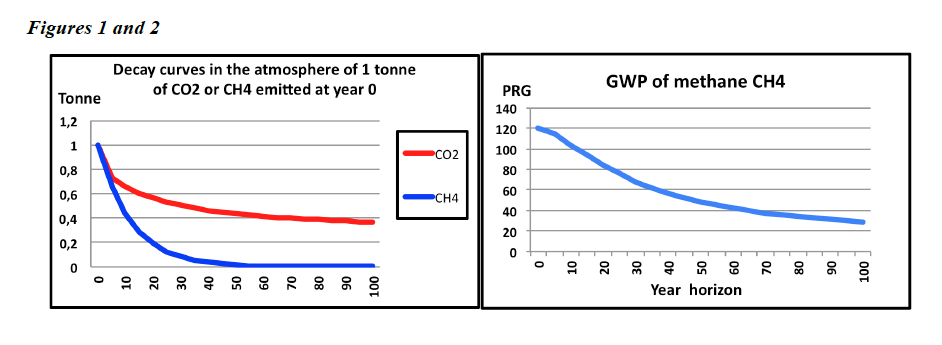
Methane presents a series of characteristics that may explain the lower importance given to it in most economic analyzes : a) Its lifetime in the atmosphere is much lower than that of CO2, of the order of a dozen years (2). At the end of complex reactions, it is transformed into different gases (water vapor, ozone, CO2), which are themselves at the origin of global warming. b) On the other hand, its radiative efficiency per unit weight is about 120 times higher than that of CO2.
The combination of these two features leads to a significant variation in the effect of CH4 on climate as a function of the time that elapses between the moment of emission and the horizon of the effects of interest. To take this into account, climatologists have developed an indicator "Global Warming Potential (GWP)" which makes it possible to compare the influence on the climate of the emissions of the various GHGs at a given time horizon : the GWP of a GHG other than CO2 is defined as the ratio between the disturbance of the radiative balance of the earth for a given period following the one-off emission of one kg of this GHG and the disturbance over the same period following the punctual emission at the same time of one kilogram of CO2. The amplitude of variation of the values of the GWP of methane, very peculiar to this gas, is the illustration (a factor of 4 over 100 years). The abacus in the appendix shows, for example, that an emission of 1 tonne of methane in 2020 "is worth", in teqCO2 : 28.5 for the year horizon 2120 (100 years later), 48.4 for the horizon 2070, 68.1 for the 2050 horizon, 104.2 for the 2030 horizon and 119.6 for the 2020 horizon. It is therefore no longer possible to use a fixed CH4-CO2 equivalence coefficient to characterize the relative efficiencies of measurements of methane and CO2 according to the horizon of the consequences of interest (3).
c) The origin of its emissions is much less well-informed than that of CO2. Few know that if agriculture and livestock are indeed responsible for the order of 40% of global methane emissions, the remaining 60% are shared between the emissions of the energy system (coal fired or coal mines, leakage of oil and gas wells, in particular shale gas, transport leakage and distribution), household and agricultural waste, forest fires.
Methane is therefore the victim of a blurred image : its dangerousness is quickly forgotten because of its short life, its emissions are associated in the minds of the public and the media to food (especially meat), a sector taboo, and quantifying its emissions remains a mystery to most of us. The concept of PRG has generally remained misunderstood and leads to misinterpretation that may be important. This complexity and this rather general misunderstanding largely explains why the growth of anthropogenic methane emissions at a worrying rate since 2005 (from 318 million tonnes to 360 Mt in eight years) does not attract much comment or research on sectoral or technical determinants of this increase. These figures highlight the particular importance of methane over the period from 1750 to 2010, even though it is still far below that of CO2, especially in a period of explosion of the use of fossils and in particular coal. This period seems now outdated and the fossil fuel CO2 emissions will decline sharply in the coming decades if the efforts undertaken are successful. Without a specific reduction effort, methane will mechanically become rapidly predominant, especially since it has recently been discovered that its harmfulness is greater than imagined. Myhre Etminan, Highwood, and Shine et al (4) have recently shown that the impact of absorption in the short infrared wavelengths (1-5μ) on the radiative forcing produced by a rise in concentration of atmospheric methane, increased by 30% the radiative forcing attributable to the absorption of long wavelengths (around 1300 cm-1).
There is a profound gap between the efforts of climate researchers to understand, both experimentally and theoretically, the behavior of methane (5) and its consideration as such in economic studies and in messages sent to policy makers. and therefore in the development of emission reduction policies specific to this gas.
As for N2O, most of its origin comes from agricultural practices, often with excessive use of nitrogen fertilizers. Its radiative efficiency is very high (about 300 times that of CO2) but as its lifetime in the atmosphere is high, this efficiency remains almost constant over 100 years. Between 1750 and 2010 its contribution to global radiative forcing is only 5.9%. In total, CO2, CH4 and N2O contribute about 95% of the radiative forcing of greenhouse gases that mix homogeneously in the atmosphere.
2. A SIMPLE ASSESSMENT OF THE IMPACT OF GHG EMISSIONS ON THE EVOLUTION OF THE ATMOSPHERE TEMPERATURE
2.1 GHG emission trajectories by 2100
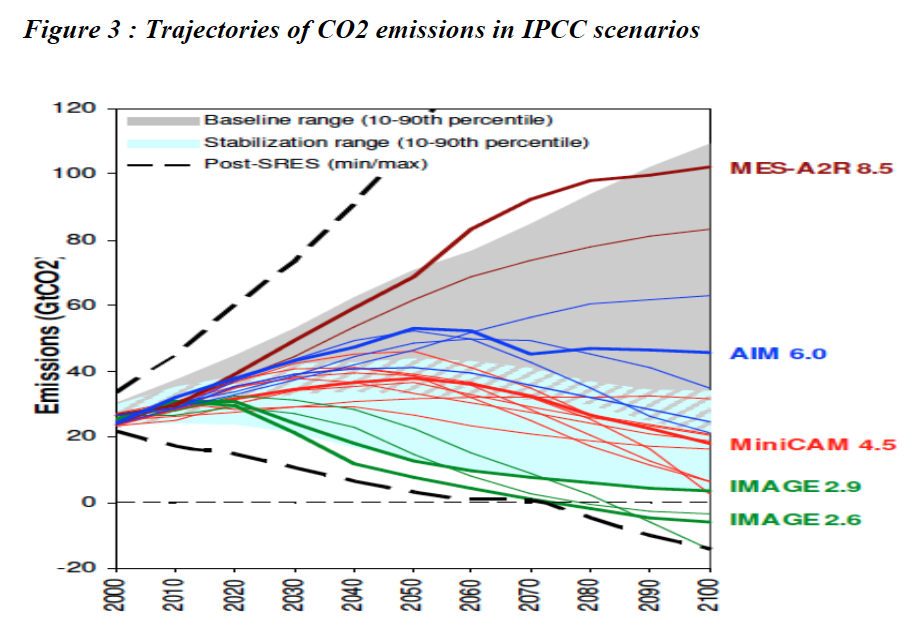
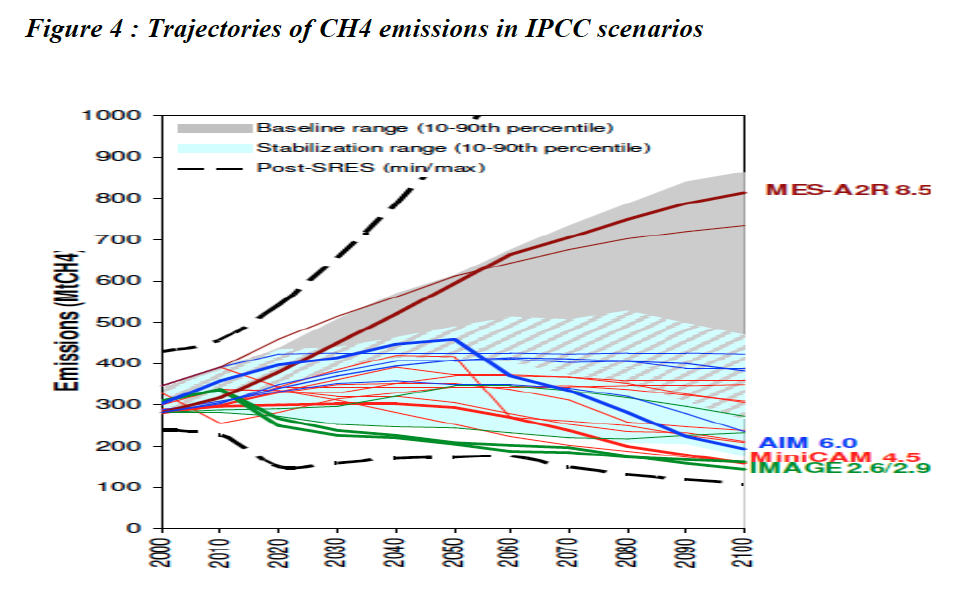
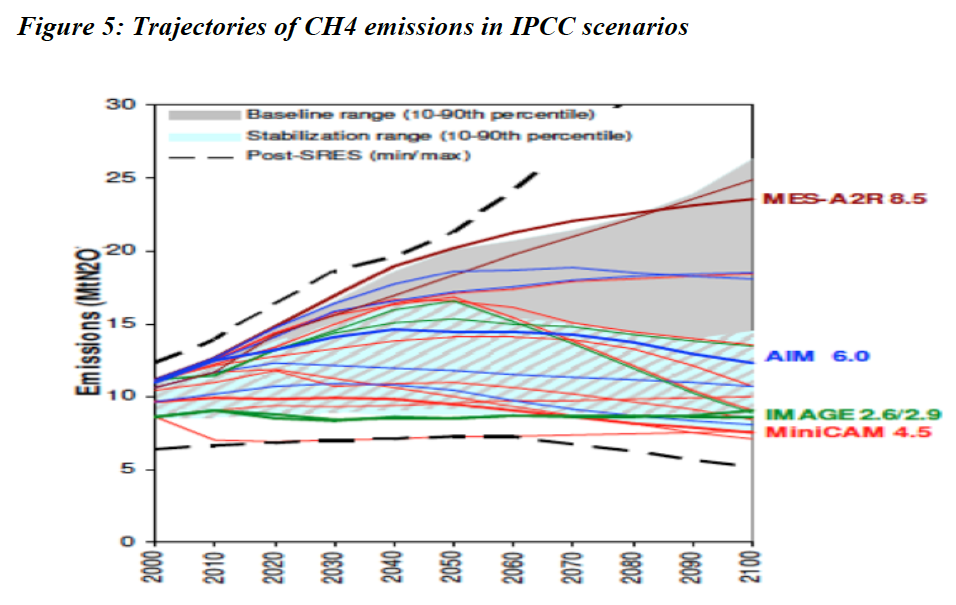
Climatologists have developed a series of families of models that can be used to estimate the temperature of the atmosphere from a description of the evolution in physical terms of GHG emissions (6) to the different horizons of contrasting scenarios. Figures 3, 4 and 5 are examples (7) of these emission path scenarios of the three main GHGs (CO2, CH4, N2O), which are now used as reference for many studies.
2.2 From emissions trajectories to global warming
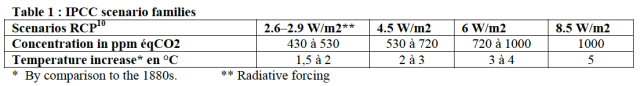
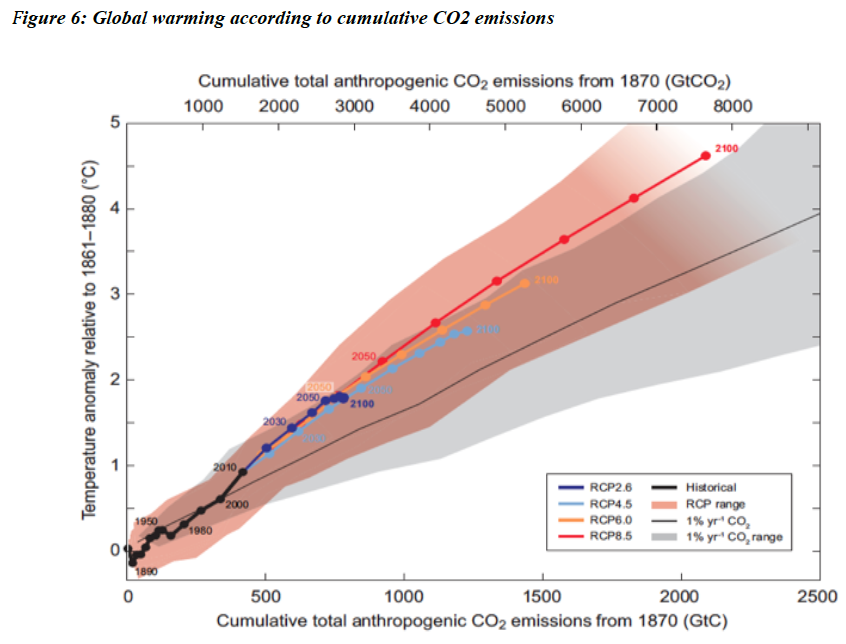
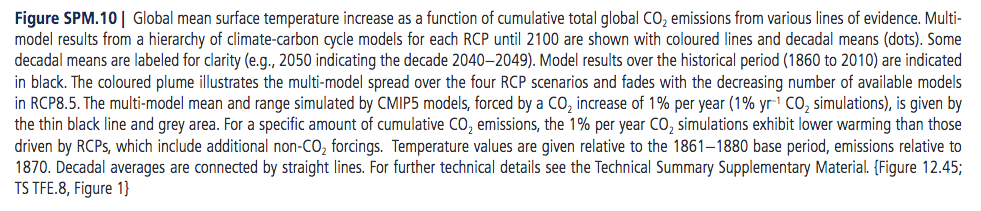
On the basis of these data, the physical and chemical properties of these gases and the time constants that govern their evolution in the atmosphere, the climatologists reconstitute the evolution of the concentrations of each of the GHGs considered, reach a "CO2 equivalent concentration" (8) (expressed in ppm eqCO2) defined as the concentration of CO2 that would produce the same effects at any time on the climate as the mix of GHGs studied, and finally the temperatures of the atmosphere over time for each of the scenarios considered. The IPCC report presented a summary of this work in the form of a graph (9) (see Figure 6) comparing four classes of scenarios considered as reference scenarios that result in contrasting concentrations, radiative forcing and temperature increases in 2100 (Table 1).
The almost linear black curve observed under the color curves associated with the different scenarios attests to the strict bond between “cumulative CO2 emissions” and “temperature increase”. We can thus consider that the line y = 0.444 / (1000 * x), y being expressed in °C and x in Gt of CO2, represents with a good margin of certainty the evolution of the average temperature on the surface of the globe according to the cumulative CO2 emissions from different scenarios. We call this line "CO2 line" in the rest of the note. The same figure 4 also shows that the temperature trajectories associated with the different scenarios are systematically above the CO2 line. This is a priori logical since the scenarios in question combine both a history of CO2 emissions and emission histories of other greenhouse gases, in particular CH4 and N2O.
2.3 Calculation of temperature increases for five representative scenarios
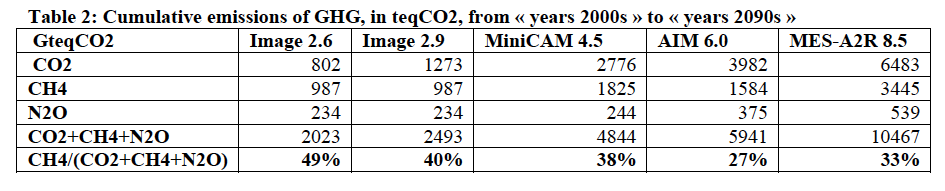
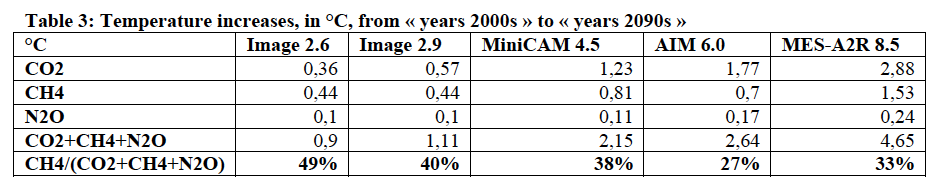
We calculated the temperature increases between the "2000s" and the "2090s" of Figure 4 for the five path scenarios presented in Section 2.1 using the "CO2 line" as follows : a) Figures 3, 4 and 5 provide the physical unit values (Gt and Mt) of the emissions of each of the three GHGs (CO2, CH4 and N2O) for each scenario. b) These values in physical units are then translated into GteqCO2, directly for CO2, with a constant GWP for N2O and, with regard to CH4, using the chart in annex that gives the GWP value, in five-year steps, for each emission from 2000 to 2120 and each year horizon from 2000 to 2120. c) GteqCO2 accumulations are then calculated for each gas between the "2000s" and the "2090s". d) Having thus calculated these accumulations, we deduce the temperature increases caused by the emissions of each of these gases according to the scenario studied by the formula :
Increase of temperature (in ° C) = 0.444 * Cumulative emisions from "years 2000s" to "years 2090s" / 1000 (in GteqCO2). Tables 2 and 3 present the results of these calculations.
We note the importance of the role of CH4 in increasing the temperature by 2100. This importance is all the greater as the scenarios show ambitious reductions in CO2.
3. A SIMPLE ALGORITHM FOR ASSESSING THE CLIMATIC CONSEQUENCES OF DIVERSIFIED SCENARIOS
3.1 A linear relationship between cumulative emissions and increased temperatures
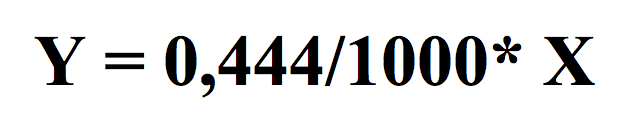
On the basis of the conclusions and comments made by the IPCC in its last report, it is therefore possible to set up an algorithm of great simplicity of use which allows a first assessment of the climatic consequences at diversified time horizons of various climate change strategies, without the need to engage in ambitious calculation campaigns based on the exploitation of different climate models. The algorithm based on an average of the results of a very large number of models is simply a linear function linking the average temperature increase at the surface of the globe at a given date to the accumulation of different greenhouse gases issued before that date, recorded in tonnes of CO2 equivalent, using the GWP value between the year of emission and the horizon year to which we are interested :
where X is measured in GteqCO2 using the GWPs of the different gases available in the form of abacuses. In practice, only CH4 has a global warming power that varies significantly over time (a ratio of 4 in 100 years). It is therefore the abacus attached to CH4 that is used (presented in Annex).
3.2 An example of use
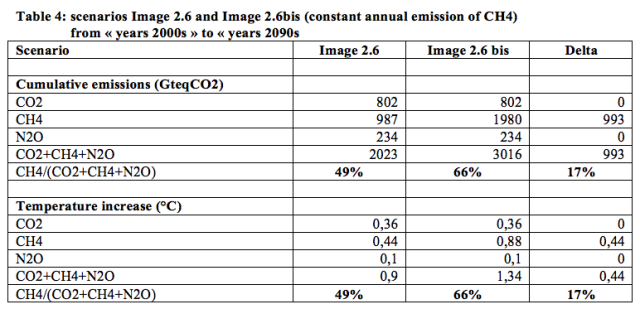
It is proposed to compare the Scenario Image 2.6 with a similar scenario Image 2.6 bis, except that the methane emissions that already reach 0.36 Gt today remain constant at this level throughout the period. This hypothesis is not unreasonable in a context of constant growth in anthropogenic methane emissions since the early 2000s and the absence of a voluntarist global policy to reduce these emissions. Table 4 compares the emissions of each of the three GHG in the 2090s and the temperature increases associated with them.
In the "constant CH4" variant Image 2.6bis, it can be seen that the temperature increase between 2000 and 2090 comes mainly from CH4. The temperature increase since 1860 that was limited in the Image 2.6 scenario to about 1.70 degree (of which 0.8 already acquired in 2020) then reaches 2.15 degrees, and clearly exceeds the two-degree limit considered as a major goal by climatologists. It can be seen that the very considerable efforts made to reduce CO2 emissions in the Image 2.6 scenario could thus be totally called into question by the absence of a sufficiently voluntarist policy to reduce CH4 over the same period.
ELEMENTS FOR CONCLUSION
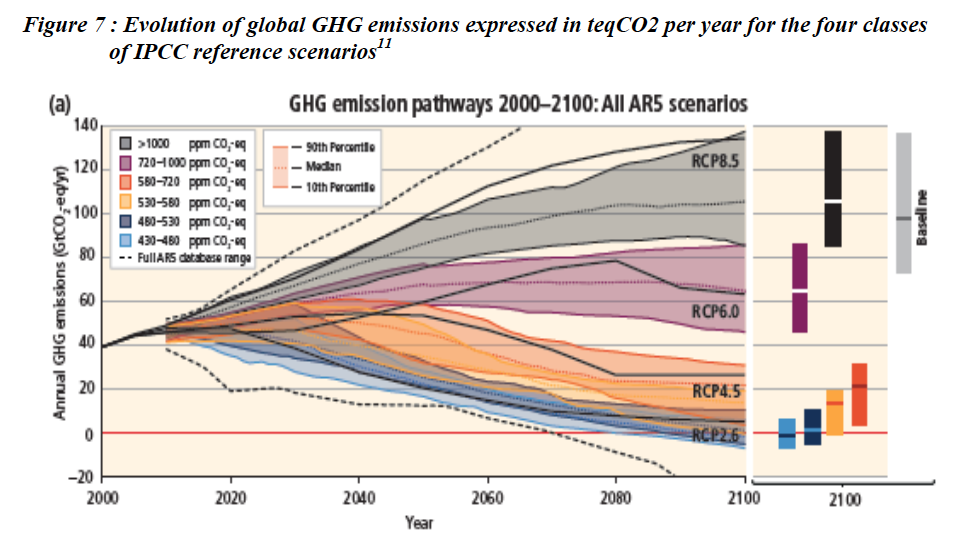
The analysis that we have just delivered, based entirely on the results presented in the most recent reports of the IPCC, leads us to highlight several points. It appears first of all that we can, through a very simple algorithm, assess temperature increases by 2100 for a wide variety of scenarios with greenhouse gas mixes that are also diversified in terms of their impact on temperature increases. attributing to each of these gases its share in the expected warming. The relation between this increase in temperature and the cumulative GteqCO2 over the entire period is : Y= 0.444*Xi/1000, where Xi is the cumulative GteqCO2 over the relevant period of the gas i. The analysis carried out, which makes it possible to discriminate the responsibility of each of the greenhouse gases in the temperature increase expected from a given emission scenario, reveals the major importance to be attributed to methane emission reductions. in the fight against global warming. It is even more necessary to be vigilant to this question than the presentation retained by the IPCC in the report already cited, illustrated by Figure 7 below based on an accounting of different greenhouse gases at 100 years and not at a fixed date (2050 or 2100 for example) largely masks the phenomenon.
By reading this figure, decision-makers can very well choose in good faith strategies that are expressed by an emissions scenario respecting the plot shown in figure 5, without realizing that the gas mix greenhouse gases they have chosen is in fact producing very different results from those expected by 2100. The algorithm that we recommend should avoid this type of confusion and allow the decision makers to assess the expected results of their strategy in relation to the stated objectives.
Lastly, in the context of the 2018 Facilitation Dialogue, this tool could help to put more emphasis on, by recognizing at fair value the reduction efforts on CH4 emissions often undertaken by some countries, in particular the developing world, and whose importance is not recognized today.
Benjamin Dessus, Bernard Laponche et Hervé Le Treut, novembre 19th, 2017
(2) This does not mean, as it is often misunderstood, that at the end of 12 years all the methane emitted has disappeared but that its decay follows an exponential law of the type e-t / 12. Only 37% of the CH4 remains twelve years after its issue, but still 19% twenty years later and 1.6% fifty years later.
(3) As a result, the arguments on the relative interest of choosing a 20 or 100 year horizon for determining the GWP of a gas such as methane are not very interesting. The only horizon that counts is that to which one wishes to estimate the influence of the punctual emission of this GES. Hence the need to use an abacus in the study of prospective scenarios, which makes it possible to attribute to each punctual emission carried out a given year the real influence it will have with respect to CO2 over the horizon. chosen observation.
(5) In particular, the “Methane Remote Lidar Sensing Mission” (MERLIN) project, developed by Germany and France, which aims to measure the spatial and temporal distribution of methane emissions. for the whole planet.
(6) GHG emissions are generally expressed in Gt (gigatonne or billion tonnes) for CO2 and Mt (megatonne or million tonnes) for CH4 and N2O.
(8) The CO2 equivalence in concentration, expressed in ppm eqCO2 is not to be confused with the emission equivalence, expressed in teqCO2. These are two different notions.
Source photo : Kër Thiossane Depuis Le Forum Social Mondial à Dakar en 2011, ce lieu de recherche, de résidence, de création et de formation est impliqué dans des projets de définition et de valorisation des « Biens Communs », sur le plan local et international... English : The story of Ker Thiossäne, Villa for Art and Multimedia
pour aller plus loin... CHANGER DE PARADIGME | LES DOSSIERS DE GLOBAL-CHANCE.ORG
 Global Chance
Une expertise indépendante sur la transition énergétique depuis 1992
Global Chance
Une expertise indépendante sur la transition énergétique depuis 1992